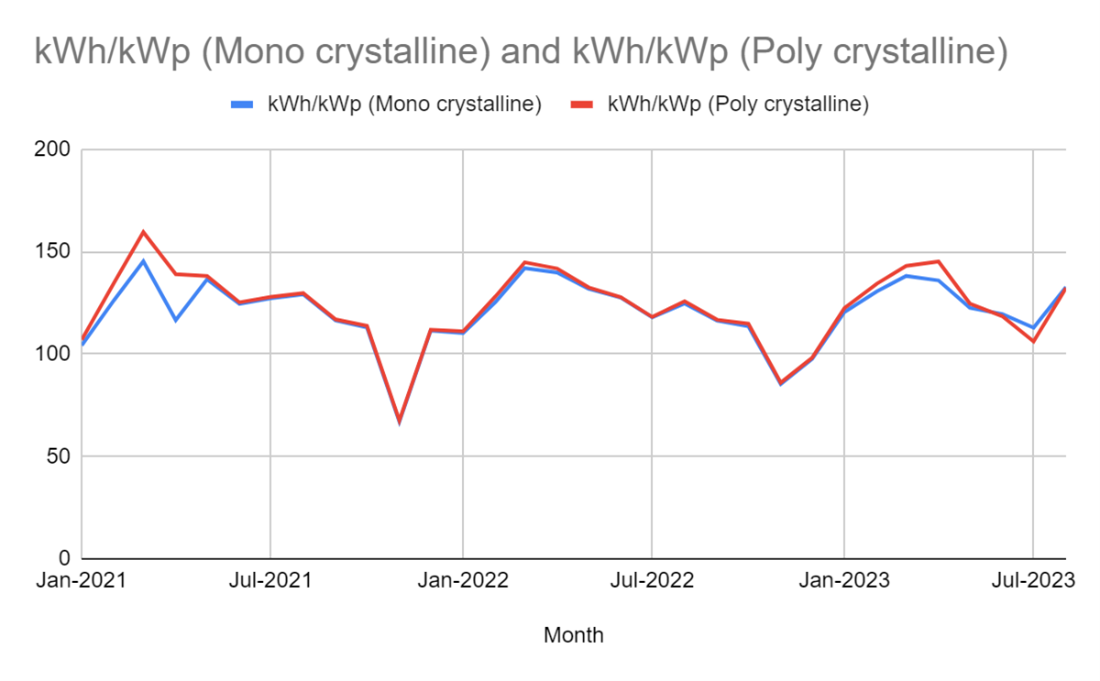
This case study examines the performance of monocrystalline and polycrystalline solar panels installed on a south-facing RCC roof over a 30-month period (January 2021 - August 2023). It analyzes energy production and efficiency, comparing both panel types under identical conditions.
Site Conditions
Monocrystalline Panels
Key Details
Polycrystalline Panels
Key Details
Performance Comparison
| Month | kWh/kWp (Mono crystalline) | kWh/kWp (Poly crystalline) | % Difference in Performance |
| 44197 | 100.1 | 101.09 | -0.0099 |
| 44228 | 101.73 | 101.47 | 0.0026 |
| 44256 | 102.72 | 101.84 | 0.0088 |
| 44287 | 101.82 | 101.92 | -0.001 |
| 44317 | 101.23 | 101.28 | -0.0005 |
| 44348 | 100.17 | 99.53 | 0.0064 |
| 44378 | 100.42 | 99.8 | 0.0062 |
| 44409 | 101.13 | 99.81 | 0.0133 |
| 44440 | 99.68 | 99.51 | 0.0017 |
| 44470 | 99.18 | 99.47 | -0.0029 |
| 44501 | 99.18 | 99.46 | -0.0028 |
| 44531 | 98.77 | 99.4 | -0.0063 |
| 44562 | 98.49 | 99.34 | -0.0085 |
| 44593 | 98.87 | 99.4 | -0.0053 |
| 44621 | 98.96 | 99.31 | -0.0035 |
| 44652 | 98.99 | 99.32 | -0.0033 |
| 44682 | 98.68 | 99.2 | -0.0052 |
| 44713 | 98.41 | 99.01 | -0.006 |
| 44743 | 97.94 | 98.65 | -0.0072 |
| 44774 | 98.27 | 98.7 | -0.0044 |
| 44805 | 97.92 | 98.4 | -0.0048 |
| 44835 | 97.63 | 98.37 | -0.0074 |
| 44866 | 97.46 | 98.33 | -0.0089 |
| 44896 | 97.23 | 98.17 | -0.0095 |
| 44927 | 97.33 | 98.18 | -0.0088 |
| 44958 | 97.95 | 98.51 | -0.0057 |
| 44986 | 98.77 | 98.85 | -0.0008 |
| 45017 | 98.83 | 98.98 | -0.0015 |
| 45047 | 98.5 | 99.02 | -0.0053 |
| 45078 | 98.46 | 98.87 | -0.0042 |
| 45108 | 97.42 | 99.27 | -0.0186 |
| 45139 | 99.23 | 98.62 | 0.0061 |

Key Findings
Potential Explanations
The higher performance of monocrystalline panels can be attributed to several factors:
Conclusion
This case study indicates that monocrystalline panels offer slightly higher performance and efficiency, especially during summer months.
